It's Tuesday, which means it's once again time for Twosday Things!
In my dauntless endeavor to blog regularly, I am continuing to write about two (big or small, mostly small) things that happened in my teaching world over the previous week. This makes the third week in a row. Not bad.
Before you read on, be sure to open up Geoff Krall's awesome PrBL starter kit in a new tab; this should be your next bit of reading after you're done here. You're welcome!
Thing #1:
One of my students (we'll call her Susie) was having trouble working through the following problem:
"Find the value of two numbers if half the larger number plus two equals the smaller number and their sum is 44."
Setting up a system of equations to represent the problem wasn't terribly much of an issue; Susie was able to do this on her own with a bit of questioning from me to prompt her thinking.
After we had set up the system, Susie seemed stuck on what to do next (though we had been working on systems of equations all week and I'd seen her succeed in completing similar problems).
Before I even said anything, another student (let's call her Nadia) offered to help explain what to do next, and I gladly obliged. Nadia used the elimination method to solve the problem while explaining her steps to Susie:
After Nadia finished, Susie seemed confused. She understood that 28 and 16 had to be the numbers described in the problem, but she wasn't clear on the elimination method that Nadia had used. "I actually thought you were supposed to plug the equation for b into the second equation," she said. Susie proceeded to solve the problem using the substitution method:
I found what happened next to be interesting: Nadia seemed confused about the method that Susie had used to get her answer, even though they both came up with the same thing! I said to them, "so Susie, it sounds like you were confused when Nadia used elimination to solve this problem, and Nadia, it sounds like you were confused when Susie used substitution." We talked about it, and both girls said the methods they each used just made more sense to them. I stressed to them that it was important to understand both of these methods (as well as solving by graphing), but also that it was great to see that each of them had their own way of figuring out this problem. As has happened in my class before, students are seeing there can be more than one path to a solution.
Thing #2:
The above situation touches on something that has been developing among my students in my classes over the past few weeks: they're starting to regularly help each other out on their own.
Stuff like the above has been happening with greater regularity in my classes. It's happened faster among my advanced students, but my other students are starting to do it as well.
A lot of classroom time is spent allowing the students to work through problems at their own pace, with me providing one-on-one or small-group assistance as needed. This can be challenging to manage, particularly with having my "regular" and "advanced" classes in my room at the same time every period.
That's part of the reason why I love it when students start to take the initiative and help each other out. I also love this kind of initiative because it's so important for students to be able to take agency of their own learning. It's an important life skill (at least I think so).
One of my classes has really figured this out. Every day, they come in and they all get with their usual groups (I did no grouping; they formed these groups on their own and they work really well). They figure out what their assignments are. If I don't have a new workshop or learning module for them, they get to work and ask me for help whenever they have questions. They're also getting very good at helping each other out, checking each other's work, and asking each other questions (Thing #1, above, happened with this group).
When students figure out how to take charge of their own learning, good things happen. One student (let's dub this one Marie) had been struggling all year with math. Last week, the small group of friends Marie regularly works with really focused on helping her understand how to solve systems of equations. They were able to give her a greater amount of attention and assistance than I was able to by myself. After a while, Marie started to be able to solve systems of equations on her own; she even got so excited about getting a problem right, that she wanted to do it on the board! AWESOME!
It's not like this every day, and it's not like this in every class. But it's starting to happen more, and it's great to have one class that's really taken off with helping each other out.
Showing posts with label algebra. Show all posts
Tuesday, November 5, 2013
Tuesday, October 29, 2013
Twosday Things: Hearts, Stars, Messy Numbers
Time again for Twosday Things!
Taking a cue from last Tuesday's post, I'll discuss two teaching-related things (however big or small) that happened over the past week. I'm trying to post about two things every Tuesday throughout the school year (hence the title, "Twosday Things"). This makes the second week in a row; so far, so good.
Thing #1:
Something I've noticed that happens A LOT in my class:
This is a near-daily occurrence in my class, despite my frequent insistence that "decimals are numbers, too!" ("Fractions are numbers, too!" is similarly used often.) I cannot even count the number of times this happens in a school year.
How does this happen? How do our students reach the point where they automatically assume that "decimal answers" must be wrong? How do we let them get to high school with this assumption cemented into their mathematical psyche?
Yesterday, I took this question to my Twitter feed:
Some super-awesome math-types from the Twittersphere chimed in with their thoughts on the topic:
"Give them messiness." I love that. I feel like our students need more practice and earlier exposure to "messy numbers," because real-world math is messy and complex. Students need to learn that decimals, fractions, irrationals, etc. are all numbers, too.
At the same time, I don't think it's inherently bad that students question their answers every time they get something "messy." Sometimes (often, in fact), their answer actually is the result of a mathematical mistake, and they need to be able to figure out where the mistake was made.
I can see some potentially good habits here: stopping to think about whether the answer makes sense in the context of the problem; double-checking work for mathematical mistakes; and so forth. I just don't think that "getting a messy answer" should be the sole reason a student thinks they did something wrong. If anything, students should be trained to question "messy" answers and "clean" answers. Students should be in the habit of doubling back and re-checking their work to make sure their reasoning makes sense.
Maybe the mistrust in "messy" numbers can be a good thing; but if it is, it needs to be applied to all numbers. Equal opportunity, darn it!
Thing #2:
Today in class, I had a few students who asked for help with the following problem:
We discussed the fact that the problem mentioned "two numbers." We had no idea what those two numbers were, offhand. But, we had enough information to be able to set up a couple of equations. We just needed to pick two variables to represent the numbers first.
"We can call these two numbers anything we want," I said. "We can call them x and y. We can call them a and b, or c and d. We could even call them stuff like, 'dollar sign' and smiley face.' What do you want to call these two numbers?"
One of my students said, "heart and star."
Math, learning, and hilarity ensued:
I had a terrible time keeping a straight face, especially when I said things like, "so what expression do we plug in for heart?" or "yep, we have to simplify by combining our star terms, so star plus eight equals twenty-four," or "there we go, star equals sixteen and heart equals forty."
It was a fun little way to talk about the concept of representing unknown values with variables. Why settle for boring old x and y when you can have a bit of fun?
Taking a cue from last Tuesday's post, I'll discuss two teaching-related things (however big or small) that happened over the past week. I'm trying to post about two things every Tuesday throughout the school year (hence the title, "Twosday Things"). This makes the second week in a row; so far, so good.
Thing #1:
Something I've noticed that happens A LOT in my class:
- Student is working through a (typically algebraic) problem.
- Student gets a non-integer answer (i.e. a "decimal answer").
- Student immediately assumes they must be wrong. Often accompanied by asking the teacher, "am I supposed to get a decimal for my answer?"
This is a near-daily occurrence in my class, despite my frequent insistence that "decimals are numbers, too!" ("Fractions are numbers, too!" is similarly used often.) I cannot even count the number of times this happens in a school year.
How does this happen? How do our students reach the point where they automatically assume that "decimal answers" must be wrong? How do we let them get to high school with this assumption cemented into their mathematical psyche?
Yesterday, I took this question to my Twitter feed:
Some super-awesome math-types from the Twittersphere chimed in with their thoughts on the topic:
"Give them messiness." I love that. I feel like our students need more practice and earlier exposure to "messy numbers," because real-world math is messy and complex. Students need to learn that decimals, fractions, irrationals, etc. are all numbers, too.
At the same time, I don't think it's inherently bad that students question their answers every time they get something "messy." Sometimes (often, in fact), their answer actually is the result of a mathematical mistake, and they need to be able to figure out where the mistake was made.
I can see some potentially good habits here: stopping to think about whether the answer makes sense in the context of the problem; double-checking work for mathematical mistakes; and so forth. I just don't think that "getting a messy answer" should be the sole reason a student thinks they did something wrong. If anything, students should be trained to question "messy" answers and "clean" answers. Students should be in the habit of doubling back and re-checking their work to make sure their reasoning makes sense.
Maybe the mistrust in "messy" numbers can be a good thing; but if it is, it needs to be applied to all numbers. Equal opportunity, darn it!
Thing #2:
Today in class, I had a few students who asked for help with the following problem:
We discussed the fact that the problem mentioned "two numbers." We had no idea what those two numbers were, offhand. But, we had enough information to be able to set up a couple of equations. We just needed to pick two variables to represent the numbers first.
"We can call these two numbers anything we want," I said. "We can call them x and y. We can call them a and b, or c and d. We could even call them stuff like, 'dollar sign' and smiley face.' What do you want to call these two numbers?"
One of my students said, "heart and star."
Math, learning, and hilarity ensued:
I had a terrible time keeping a straight face, especially when I said things like, "so what expression do we plug in for heart?" or "yep, we have to simplify by combining our star terms, so star plus eight equals twenty-four," or "there we go, star equals sixteen and heart equals forty."
It was a fun little way to talk about the concept of representing unknown values with variables. Why settle for boring old x and y when you can have a bit of fun?
Tuesday, October 22, 2013
Two Things From a Tuesday
Or maybe I should title this post "Twosday Things." Because I like portmanteaus.
Thing #1:
Today, I was talking one-on-one with a student about functions. We were talking about the relationship between domain and range, and how to tell if two sets of values make up the domain and range of a function. We talked about how values in the domain are each assigned to one and only one value in the range by the function. I chimed in with the "mailbox analogy" to further explain the relationship: say you're mailing a bunch of letters. The stack of letters is like the domain, and the houses the letters are being mailed to are like the range. You can mail multiple letters to the same house, but you can't mail the same letter to multiple houses. "So you can't mail the same letter to Chicago, New York, and San Francisco simultaneously," I said to the student.
"Unless it's e-mail," the student replied.
HOLY CRAP. That was a really, really good point! I was utterly stunned that I hadn't thought of that. I guess the analogy kind of breaks down in that regard if you throw e-mail into the mix. I'm still pretty sure I got my point across, but it does have me thinking about the analogy I'm using to describe how functions work. Will this be an outdated analogy in the near future?
Either way, I was super-impressed by my student today.
Thing #2:
Some of my students are currently working on compound inequalities. Below is a piece of student work that I found interesting:
The left side of the compound inequality vanished! I've actually been seeing this happen with several students in my class; every time they get one side of a compound inequality equal to zero, they omit it in the rest of their work.
I've been wondering where this is coming from. I imagine it might have something to do with the fact that students are sometimes taught about the existence of an "implied" zero that isn't actually shown. (For example, what is the slope of the line y = 2? There's no x-term, but there's an implied "0x" in the equation; thus, y = 0x + 2, and the line has a slope of 0.)
Maybe it's coming from somewhere else. I don't think it's anything I've done, but I could be wrong.
Anyway, that's two things from a Tuesday. Maybe I'll try to do this weekly, so I'm blogging more often.
Thing #1:
Today, I was talking one-on-one with a student about functions. We were talking about the relationship between domain and range, and how to tell if two sets of values make up the domain and range of a function. We talked about how values in the domain are each assigned to one and only one value in the range by the function. I chimed in with the "mailbox analogy" to further explain the relationship: say you're mailing a bunch of letters. The stack of letters is like the domain, and the houses the letters are being mailed to are like the range. You can mail multiple letters to the same house, but you can't mail the same letter to multiple houses. "So you can't mail the same letter to Chicago, New York, and San Francisco simultaneously," I said to the student.
"Unless it's e-mail," the student replied.
HOLY CRAP. That was a really, really good point! I was utterly stunned that I hadn't thought of that. I guess the analogy kind of breaks down in that regard if you throw e-mail into the mix. I'm still pretty sure I got my point across, but it does have me thinking about the analogy I'm using to describe how functions work. Will this be an outdated analogy in the near future?
Either way, I was super-impressed by my student today.
Thing #2:
Some of my students are currently working on compound inequalities. Below is a piece of student work that I found interesting:
The left side of the compound inequality vanished! I've actually been seeing this happen with several students in my class; every time they get one side of a compound inequality equal to zero, they omit it in the rest of their work.
I've been wondering where this is coming from. I imagine it might have something to do with the fact that students are sometimes taught about the existence of an "implied" zero that isn't actually shown. (For example, what is the slope of the line y = 2? There's no x-term, but there's an implied "0x" in the equation; thus, y = 0x + 2, and the line has a slope of 0.)
Maybe it's coming from somewhere else. I don't think it's anything I've done, but I could be wrong.
Anyway, that's two things from a Tuesday. Maybe I'll try to do this weekly, so I'm blogging more often.
Tuesday, October 8, 2013
Multiple Solutions (A follow-up to "When Is the Right Answer the Right Answer?")
A couple of weeks ago, I wrote this post about how I wanted my students to determine equations of lines, given certain information. The broader point, I think, was realizing that my students had more than one option for determining answers to the problems they were working on, and being okay with that. (Why wouldn't I be?)
I had another "when is the right answer the right answer?" moment in class yesterday that I thought was really super-cool.
Two students were working together on the same problem. They came up with what they thought were different answers, so they were wondering who was correct. Their work is shown below:
So both students used point-slope form for their equations, and came up with two answers that looked different. This peculiarity made them wonder who was right and who was wrong. (Which, in turn, makes me realize that I still have a lot of work to do with teaching them about making sense versus being right.) They called me over to ask me who had the correct equation.
I must have been really busy at that moment and not really thinking, because I looked at their answers and said, "actually, you're both right." Not that I was wrong in saying so; but I regret that I didn't recognize the teachable moment that had presented itself. This would have been a great opportunity to ask each of them what they thought about their equations, how they came up with them, why they thought their answers made sense, why the other person got something different, and whether or not it made a difference which point they used for point-slope form. Still, it was a really cool moment: two students have a spirited debate over who had the "right" equation, when really they were both right. It was my favorite moment of class from yesterday.
Fortunately, the same thing happened today, on the same problem, with the same work as shown above, between a different pair of students. Grateful for a second chance, I was able to stop and facilitate an awesome math discussion between the two of them.
One student was adamant that the "first" point, (-4, 3), had to be plugged in for point-slope form instead of the "second" point, "because they're X1 and Y1," she reasoned. She said this because she had labeled the coordinates as such when using the slope formula to determine the slope:
And point-slope form was written on the board as Y - Y1 = (X - X1). So I could see where she was coming from.
I asked her, "so, how would you label these points if the order was swapped?" In other words, what if the problem listed the points "(6, 1) and (-4, 3)" instead of the order they were given? She responded that she would have labeled (6, 1) as (X1, Y1) and (-4, 3) as (X2, Y2).
My next question was, "So would that change things? Would you get a different slope, for instance?" The student initially thought that yes, she would get a different slope. The other student, who was working with her, said that the slope should be the same. I had both of them determine the slope of the line with the different designations for the coordinates; naturally, the slopes turned out to be the same as in their original work.
I asked, "how did changing the order of the points affect the slope?" The student replied that the order of the points didn't change the slope at all. "Cool," I said. "So what about the two different equations you guys came up with? What difference does choosing one point over the other [when plugging a point into point-slope form] make?" The first student still wasn't quite convinced that it didn't matter what point she chose; her partner said it didn't matter what point was chosen for the point-slope form of the equation.
We decided to have each of them solve their equations for y, so they'd both be in slope-intercept form. When they did so, they came up with the same equation, and the first student was finally convinced that it didn't matter which of the two points she chose. Both students were convinced that they'd both determined correct equations for the line described in the problem. "Why doesn't it matter which point you choose?" I asked. The first student wasn't quite sure. The second student guessed, "because both points are on the same line?" I replied, "that sounds like it makes sense."
I love when students find different (yet equally valid) solutions to problems like this. It makes for some great discussion. I need to keep myself aware that it's more important to ask my students to make sense of their work instead of telling them that they're right; I missed out on having a great conversation with two students yesterday, but I'm glad I had another chance at it today.
I had another "when is the right answer the right answer?" moment in class yesterday that I thought was really super-cool.
Two students were working together on the same problem. They came up with what they thought were different answers, so they were wondering who was correct. Their work is shown below:
So both students used point-slope form for their equations, and came up with two answers that looked different. This peculiarity made them wonder who was right and who was wrong. (Which, in turn, makes me realize that I still have a lot of work to do with teaching them about making sense versus being right.) They called me over to ask me who had the correct equation.
I must have been really busy at that moment and not really thinking, because I looked at their answers and said, "actually, you're both right." Not that I was wrong in saying so; but I regret that I didn't recognize the teachable moment that had presented itself. This would have been a great opportunity to ask each of them what they thought about their equations, how they came up with them, why they thought their answers made sense, why the other person got something different, and whether or not it made a difference which point they used for point-slope form. Still, it was a really cool moment: two students have a spirited debate over who had the "right" equation, when really they were both right. It was my favorite moment of class from yesterday.
Fortunately, the same thing happened today, on the same problem, with the same work as shown above, between a different pair of students. Grateful for a second chance, I was able to stop and facilitate an awesome math discussion between the two of them.
One student was adamant that the "first" point, (-4, 3), had to be plugged in for point-slope form instead of the "second" point, "because they're X1 and Y1," she reasoned. She said this because she had labeled the coordinates as such when using the slope formula to determine the slope:
And point-slope form was written on the board as Y - Y1 = (X - X1). So I could see where she was coming from.
I asked her, "so, how would you label these points if the order was swapped?" In other words, what if the problem listed the points "(6, 1) and (-4, 3)" instead of the order they were given? She responded that she would have labeled (6, 1) as (X1, Y1) and (-4, 3) as (X2, Y2).
My next question was, "So would that change things? Would you get a different slope, for instance?" The student initially thought that yes, she would get a different slope. The other student, who was working with her, said that the slope should be the same. I had both of them determine the slope of the line with the different designations for the coordinates; naturally, the slopes turned out to be the same as in their original work.
I asked, "how did changing the order of the points affect the slope?" The student replied that the order of the points didn't change the slope at all. "Cool," I said. "So what about the two different equations you guys came up with? What difference does choosing one point over the other [when plugging a point into point-slope form] make?" The first student still wasn't quite convinced that it didn't matter what point she chose; her partner said it didn't matter what point was chosen for the point-slope form of the equation.
We decided to have each of them solve their equations for y, so they'd both be in slope-intercept form. When they did so, they came up with the same equation, and the first student was finally convinced that it didn't matter which of the two points she chose. Both students were convinced that they'd both determined correct equations for the line described in the problem. "Why doesn't it matter which point you choose?" I asked. The first student wasn't quite sure. The second student guessed, "because both points are on the same line?" I replied, "that sounds like it makes sense."
I love when students find different (yet equally valid) solutions to problems like this. It makes for some great discussion. I need to keep myself aware that it's more important to ask my students to make sense of their work instead of telling them that they're right; I missed out on having a great conversation with two students yesterday, but I'm glad I had another chance at it today.
Sunday, September 29, 2013
When Is the Right Answer the Right Answer?
This week, my students have been working on determining equations of a line based on properties of parallel and perpendicular lines (GRE 604 from the ACT College Readiness Standards for Mathematics), which involves problems like this one:
Several concepts popped up throughout the week while working on this skill: determining slope, slope-intercept form, point-slope form, and the relationships of slopes between lines that are either parallel or perpendicular to each other.
Throughout the week, I have been insisting that my students give their solutions to these problems in slope-intercept form, as shown in this student's work:
Perfectly reasonable solution method, isn't it? Put the original line equation in slope-intercept form, determine the slope, use point-slope form to get the equation of the parallel line, and then solve for y to put that equation in slope-intercept form.
This morning, I found myself wondering why I was insisting on having my students put their answer in slope-intercept form.
Is it really necessary? I mean, couldn't the student have just stopped at point-slope form and still been correct? I mean, plug a few things into Desmos and it's hard to argue otherwise:
I've been thinking about this and struggling with this all morning. The focus of this particular ACT skill isn't necessarily for students to determine the equation of line and put it in slope-intercept form; the skill is just to determine the equation of a line based on properties of parallel and perpendicular lines.
In the problem above, the student is given the equation of a line and a point on another line that is parallel. The student knew to look for the slope of the original line, knowing that the parallel line they were looking for would have the same slope. After determining the slope, the student created the equation of the parallel line using point-slope form.
Should it stop there? After all, the student correctly applied the properties of parallel lines and determined a correct equation. That's what the skill is all about, right? Why was I insisting that the student put their answer in slope-intercept form? I'm not sure it's necessary, and I think it also creates a situation where the student can make a simple algebra mistake and come up with an equation that is no longer "correct." On the other hand, expecting students to be able to put the equation in slope-intercept form isn't all that unreasonable, is it? After all, the student did just that with the equation of the original line in the problem, in order to determine the slope of the parallel line. Is that a good enough reason to insist on it, though?
This is just one specific case. I know this isn't the only instance in mathematics where something like this happens. When is the right answer the right answer?
Several concepts popped up throughout the week while working on this skill: determining slope, slope-intercept form, point-slope form, and the relationships of slopes between lines that are either parallel or perpendicular to each other.
Throughout the week, I have been insisting that my students give their solutions to these problems in slope-intercept form, as shown in this student's work:
(There are some other things going on here that would also be interesting to talk about, but that will have to wait for another day.)
Perfectly reasonable solution method, isn't it? Put the original line equation in slope-intercept form, determine the slope, use point-slope form to get the equation of the parallel line, and then solve for y to put that equation in slope-intercept form.
This morning, I found myself wondering why I was insisting on having my students put their answer in slope-intercept form.
Is it really necessary? I mean, couldn't the student have just stopped at point-slope form and still been correct? I mean, plug a few things into Desmos and it's hard to argue otherwise:
I've been thinking about this and struggling with this all morning. The focus of this particular ACT skill isn't necessarily for students to determine the equation of line and put it in slope-intercept form; the skill is just to determine the equation of a line based on properties of parallel and perpendicular lines.
In the problem above, the student is given the equation of a line and a point on another line that is parallel. The student knew to look for the slope of the original line, knowing that the parallel line they were looking for would have the same slope. After determining the slope, the student created the equation of the parallel line using point-slope form.
Should it stop there? After all, the student correctly applied the properties of parallel lines and determined a correct equation. That's what the skill is all about, right? Why was I insisting that the student put their answer in slope-intercept form? I'm not sure it's necessary, and I think it also creates a situation where the student can make a simple algebra mistake and come up with an equation that is no longer "correct." On the other hand, expecting students to be able to put the equation in slope-intercept form isn't all that unreasonable, is it? After all, the student did just that with the equation of the original line in the problem, in order to determine the slope of the parallel line. Is that a good enough reason to insist on it, though?
This is just one specific case. I know this isn't the only instance in mathematics where something like this happens. When is the right answer the right answer?
Wednesday, September 18, 2013
Coffee Spills! Sales Sheets! Math!
I like to think I have good taste in music. When I was a kid, I played a lot of video games. Video games are super fun. The best part about video games, arguably, is the music. I will always hold the opinion that the Super Nintendo era gave us some of the best video game tunes in the history of ever. EVER.
So, these days I listen to a lot of video game music (VGM) cover bands. One of my current favorites is a recently-formed act, The Returners. They're based in Austin, TX and they totally rock.
But they don't totally rock just because of their music. They totally rock because the band's founder, Lauren Liebowitz, recently helped me out with putting together a math task that involved coffee spills and band shirts.
Background
Over the past couple of years, the math team at my school worked together to put a four-year curriculum in place that's closely aligned to the ACT college readiness standards in mathematics. The skill that my students are currently working on is XEI 602:
"Write expressions, equations, and inequalities for common algebra settings."
We wrote a ton of problems related to each skill. For this particular skill, we wrote problems such as the following:
To supplement this skill, I thought of a different way to present this type of problem. Instead of spelling out the necessary mathematical information in a word problem, I wanted to present a more realistic situation and have the students work a little bit more to dig up the mathematics of what was happening.
So I thought of the following scenario: Suppose you were selling a few different items and keeping track of your sales on a sheet, such as this:
And then, suppose you accidentally spilled coffee all over it:
Some of the information is lost! How could we figure out the information that was ruined by the coffee spill? (Obviously, there isn't enough mathematical information in the above example, which is purely for show. But given the right info, this becomes a challenging math task. Also, as it turns out, it's pretty challenging to simulate a coffee spill. And ink is pretty resilient these days.)
The Task
I spent some time thinking about what product(s) to include on the sales sheet that I was going to spill coffee on. One night, I was folding laundry and I came across my official "The Returners" t-shirt. My brain was like, "BAM. T-shirts!"
I messaged Lauren to pretty much say, "Hey, I'm using your band in a math problem!" And she basically replied, "Cool! Can I do anything to help?" And actually involving her hadn't really occurred to me, but she was totally willing to assist and I couldn't turn that chance down.
I put together a "sales sheet" listing three different types of Returners shirts, with information about prices and inventory. Then I spilled coffee on it:
Lauren included the following e-mail, and also sent along a picture of a few of her band's shirts (rolled up neatly into little shirt burritos):
Armed with the above information, my students were set to the task of helping Lauren figure out how many shirts were sold at her most recent show.
How The Task Went
I put the students in groups of three for this task. They were each given a copy of the e-mail, the ruined sales sheet, and the photo of the remaining shirts. I also gave them a worksheet with a few questions that each group member needed to contribute to.
My first period jumped into this task right away. There were a lot of good conversations going on at the start: they were looking through the documents, figuring out what information was important, and talking about how they were going to represent each type of shirt as variables in equations.
There was debate over how to represent "blue" versus "black," since both started with the same letter. Some students decided to use b for one and bl for another, but soon found that there was still no distinction (since both colors start with the letters bl). One student finally suggested using k for black, which certainly helped things.
Students were able to figure out important bits and pieces of information needed to set up an equation to represent the total sales: from the sales sheet, they found the total money made and the cost of each shirt. From the picture, they were able to determine that there were 5 blue shirts and 3 gray shirts that went unsold from the original inventory.
Where we ran into trouble was figuring out how to actually set up equations representing the total sales. Groups during my first period class initially set up their equation as:
After my first period class, I adjusted my lesson plan so that we talked about the correct expressions for shirts sold toward the beginning of the activity. This adjustment made things go more smoothly in my other three classes. Although, in my second period class, students were having trouble with question #2, which required them to re-write their equation from question #1 in terms of one variable. We stopped to have another conversation about what to do.
I asked students to re-read their e-mails and to look specifically for relationships between the different types of shirts and how many of each kind there were. The students noticed the following info:
Once we were armed with these equations, we were able to go back to our total sales equation from question #1 and use substitution to re-write it in terms of one variable:
I made another adjustment to my lesson plan for my third and fourth period classes to include a discussion about representing these relationships toward the beginning of the task as well. With this guidance, students were able to successfully determine how many shirts had been sold:
What I Would Change Next Time
This task was given to the students while we were in the middle of our mini-unit on writing equations and expressions based on information from word problems. After doing this task and reflecting on how things went, I think this task has a lot of merit as one of two things:
In the future, I would probably embed further scaffolding and questions into this activity. For instance, I would probably ask the students:
I might also change the prices and the types of merchandise on the sales sheet in the future; a few students looked at the prices and thought, "why didn't they just sell shirts for $5? It'd be easier to make change." In reality, the shirt prices are actually more like that. I made each shirt a different price; otherwise, the task would have been pretty easy to solve. Next time, I'd probably include other merchandise such as CDs, buttons, etc. and let the prices reflect something that would actually be charged at a show.
Overall, I was pleased with this task. I certainly learned a lot, and I hope to come up with even better tasks in the future and I continue trying to figure out how to do PrBL!
So, these days I listen to a lot of video game music (VGM) cover bands. One of my current favorites is a recently-formed act, The Returners. They're based in Austin, TX and they totally rock.
But they don't totally rock just because of their music. They totally rock because the band's founder, Lauren Liebowitz, recently helped me out with putting together a math task that involved coffee spills and band shirts.
Background
Over the past couple of years, the math team at my school worked together to put a four-year curriculum in place that's closely aligned to the ACT college readiness standards in mathematics. The skill that my students are currently working on is XEI 602:
"Write expressions, equations, and inequalities for common algebra settings."
We wrote a ton of problems related to each skill. For this particular skill, we wrote problems such as the following:
(And actually, that should be 46 cakes, not 44. Typo. Oops.)
To supplement this skill, I thought of a different way to present this type of problem. Instead of spelling out the necessary mathematical information in a word problem, I wanted to present a more realistic situation and have the students work a little bit more to dig up the mathematics of what was happening.
So I thought of the following scenario: Suppose you were selling a few different items and keeping track of your sales on a sheet, such as this:
And then, suppose you accidentally spilled coffee all over it:
Some of the information is lost! How could we figure out the information that was ruined by the coffee spill? (Obviously, there isn't enough mathematical information in the above example, which is purely for show. But given the right info, this becomes a challenging math task. Also, as it turns out, it's pretty challenging to simulate a coffee spill. And ink is pretty resilient these days.)
The Task
I spent some time thinking about what product(s) to include on the sales sheet that I was going to spill coffee on. One night, I was folding laundry and I came across my official "The Returners" t-shirt. My brain was like, "BAM. T-shirts!"
I messaged Lauren to pretty much say, "Hey, I'm using your band in a math problem!" And she basically replied, "Cool! Can I do anything to help?" And actually involving her hadn't really occurred to me, but she was totally willing to assist and I couldn't turn that chance down.
I put together a "sales sheet" listing three different types of Returners shirts, with information about prices and inventory. Then I spilled coffee on it:
Lauren included the following e-mail, and also sent along a picture of a few of her band's shirts (rolled up neatly into little shirt burritos):
Armed with the above information, my students were set to the task of helping Lauren figure out how many shirts were sold at her most recent show.
How The Task Went
I put the students in groups of three for this task. They were each given a copy of the e-mail, the ruined sales sheet, and the photo of the remaining shirts. I also gave them a worksheet with a few questions that each group member needed to contribute to.
My first period jumped into this task right away. There were a lot of good conversations going on at the start: they were looking through the documents, figuring out what information was important, and talking about how they were going to represent each type of shirt as variables in equations.
There was debate over how to represent "blue" versus "black," since both started with the same letter. Some students decided to use b for one and bl for another, but soon found that there was still no distinction (since both colors start with the letters bl). One student finally suggested using k for black, which certainly helped things.
Students were able to figure out important bits and pieces of information needed to set up an equation to represent the total sales: from the sales sheet, they found the total money made and the cost of each shirt. From the picture, they were able to determine that there were 5 blue shirts and 3 gray shirts that went unsold from the original inventory.
Where we ran into trouble was figuring out how to actually set up equations representing the total sales. Groups during my first period class initially set up their equation as:
5.25k + 4.75b + 4.50g = 397.25
where k represents black shirts, b represents blue shirts, and g represents gray shirts. The above equation was close, but incorrect; students from my first period continued working through the problem using this equation and ended up getting answers that didn't make sense in the context of the problem (e.g. they got non-integer values when they solved for k, b, and g).
They were on the right track, but they didn't account for the fact that a few shirts went unsold; this was kind of the "tricky" part of the task and led to a lot of frustration among my first period students. I let them have some time to try and sort things out on their own and dropped a few hints to try and point them in the right direction. Eventually, I saw it was going to be best to stop and have a quick whole-class discussion about the unsold shirts.
We talked about thinking of k, b, and g as the number of shirts that were originally in the inventory as opposed to the number of shirts that were sold. I asked the students to look through their documents again and tell me what they could find about the number of shirts that were sold and the number of shirts that were still left. We talked about what expressions we should write to represent the number of shirts that were sold. Eventually, we came up with the following:
- The black shirts were sold out, so k black shirts were sold.
- There were 5 blue shirts remaining, so b - 5 blue shirts were sold.
- There were 3 gray shirts remaining, so g - 3 gray shirts were sold.
After my first period class, I adjusted my lesson plan so that we talked about the correct expressions for shirts sold toward the beginning of the activity. This adjustment made things go more smoothly in my other three classes. Although, in my second period class, students were having trouble with question #2, which required them to re-write their equation from question #1 in terms of one variable. We stopped to have another conversation about what to do.
I asked students to re-read their e-mails and to look specifically for relationships between the different types of shirts and how many of each kind there were. The students noticed the following info:
- There were twice as many black shirts as either the blue or gray shirts.
- The number of blue shirts was the same as the number of gray shirts.
Once we were armed with these equations, we were able to go back to our total sales equation from question #1 and use substitution to re-write it in terms of one variable:
I made another adjustment to my lesson plan for my third and fourth period classes to include a discussion about representing these relationships toward the beginning of the task as well. With this guidance, students were able to successfully determine how many shirts had been sold:
What I Would Change Next Time
This task was given to the students while we were in the middle of our mini-unit on writing equations and expressions based on information from word problems. After doing this task and reflecting on how things went, I think this task has a lot of merit as one of two things:
- A guided task at the beginning of, or during, the unit, with appropriate scaffolding included; or
- A performance task at the end of the unit.
In the future, I would probably embed further scaffolding and questions into this activity. For instance, I would probably ask the students:
- What is the problem you are being asked to solve? What information are you supposed to determine?
- Choose a variable to represent each different type of shirt. Write expressions to represent the amount of each shirt that was sold.
- From the e-mail, what information can you determine about the number of shirts that Lauren originally had? Write equations that represent these relationships.
I might also change the prices and the types of merchandise on the sales sheet in the future; a few students looked at the prices and thought, "why didn't they just sell shirts for $5? It'd be easier to make change." In reality, the shirt prices are actually more like that. I made each shirt a different price; otherwise, the task would have been pretty easy to solve. Next time, I'd probably include other merchandise such as CDs, buttons, etc. and let the prices reflect something that would actually be charged at a show.
Overall, I was pleased with this task. I certainly learned a lot, and I hope to come up with even better tasks in the future and I continue trying to figure out how to do PrBL!
Sunday, July 28, 2013
BATTLESHIP! - Graphing Equations of Circles
I've been dying to incorporate more PrBL tasks into my classroom. For the past couple of years, our math team spent a huge deal of time and energy on a complete overhaul of our four-year math curriculum in order to more strongly align it with ACT College Readiness Standards. It was certainly a worthwhile endeavor; I'm very proud of what our awesome math team has accomplished, and I think our students will greatly benefit from what we've done so far.
At the same time, this pretty much meant I had zero time to work on any PrBL stuff, especially with moving from teaching Geometry to teaching Pre-Calculus at the same time. However, our project was finally completed this past spring, so I have been happily spending the summer working on PrBL-related curriculum mapping for my Pre-Calculus and Advanced Pre-Calculus classes.
(Yes, I just said "happily" and "curriculum mapping" in the same sentence.)
Below is one PrBL task that I've been working on for a graphing unit this school year. I think (and hope) the students will have fun with it; it's not particularly all that "real-worldy," and it definitely needs refinement, but I gotta start somewhere. Of course, as with anything I haven't tried in class yet, it's a work in progress.
This task involves understanding and graphing equations of circles. I call it: BATTLESHIP!
The Scenario: You are the commander of a mighty naval fleet in the middle of international waters. The enemy has developed a new type of submarine known as a Hyperbolic Invisibility/Deep Dive ENgine, or a H.I.D.D.EN. submarine.
The enemy's H.I.D.D.EN. submarines are capable of avoiding nearly all types of radar detection. In fact, you are only able to determine the distance a H.I.D.D.EN. submarine is from any of your naval stations.
Your task is to devise a way to pinpoint the exact location of a H.I.D.D.EN. submarine. Succeed, and your forces will be able to destroy the enemy fleet. Fail, and you're doomed. DOOMED!
(If you couldn't tell, I have an affinity for silly acronyms.)
The Entry Event: Before things really kick off, I'll give the students a few warm-up problems to assess and activate their prior knowledge. Students will need to know the parts of a circle (particularly the radius and the center), and will also need to be able to re-write a two-variable equation (i.e. solve for y in terms of x). The latter will be important for graphing circles on most graphing utilities.
To introduce the problem, I'll present the following situation to students on Activeprompt:
"You are the commander of a naval station, shown here on the grid. An enemy submarine is approaching.
The submarine has a cloaking device that hides its exact location from your radar system. However, you are still able determine how far away the submarine is from the station.
The submarine is 5 miles away from the station. Where is it?"
I posted this prompt on Twitter, and a couple of my friends immediately pointed out that they couldn't answer the question because they didn't know which direction the submarine was from the station. This is true, and in many ways is actually the point of this prompt; I suppose I should be more clear that I want students to guess where the submarine might be, and that I'm not necessarily looking for "the correct answer" at this stage.
Still, I had several responses to the prompt and ended up with something I would hope to see in class:
Hopefully, students will take one look at this picture and notice the pattern: there appears to be a circle forming around the station. At this point, students can take some time to think about further questions: Why is there a circle? What does this circle mean? What can we figure out about this circle? What does this circle have to do with finding the submarine?
After discussion, the hope is that students would come to the following conclusions:
Need-to-Knows & Scaffolding: While I'm sure that my students will surprise me (students have a habit of doing that), the need-to-know that should be immediately apparent is: "How do we locate the submarine?" In fact, we begin the process of answering this question with the entry event.
Again, one of the key realizations from the entry event is that all of the possible locations of the submarine are represented by a circle, radius 5, with the naval station as its center:
A good follow-up question would be, "How do we narrow down the number of possible locations?" The answer may or may not be readily apparent. I'd encourage students to think outside the box -- or perhaps, more appropriately, "think outside the circle."
Because we could narrow down the number of possible locations if we had a second naval station. Say, at coordinates (7, -8). And it detects the submarine at a distance of 7 miles.
Aha! Just like that, we've narrowed our possible locations down to two; namely, the two points (1 and 2) where the circles intersect each other. (It certainly wouldn't hurt to have the students explain why these are the only two places the submarine could be.)
From here, it probably won't be a huge leap for the students to realize that adding a third naval station will narrow our choices down to just one. We'll get back to that in a moment.
A critical issue arises from this new picture: while Point 2 clearly appears to be located at the coordinates (7, -1), it's much less clear what the coordinates of Point 1 are. This should lead to another question: "How do we accurately determine the coordinates of the point(s) where the circles intersect?"
Now, this part of the task is a bit murky for me. It's not all that difficult to come up with a good estimate of Point 1's coordinates using Geometer's Sketchpad, but the point of the task is for students to work with and understand equations of circles. To this end, I want students to be working with a graphing utility (e.g. TI-83/84) as we address this question. So, yeah... if anyone has a good suggestion for how to make sure it steers in that direction, I'm all ears!
In any case, turning to our graphing calculators should bring up the question: "How do we graph circles?" The best way to do this with our graphing calculators (or an online tool like Desmos) would be to input an equation. That, of course, leads to: "What's the equation for a circle?"
At this point, appropriate scaffolding activities and workshops could be used to help students understand how to determine the equation of a circle, given the center and the radius. I'd probably also give students a few practice problems to give them some exercise in this skill. When using a graphing calculator like a TI-83 or TI-84, students would also need to know how to re-write their circle equations for y in terms of x so they can actually enter them. (This would be one advantage of using Desmos over a graphing calculator; such a conversion isn't necessary. On the other hand, re-writing equations would also be a great chance to talk about issues such as positive and negative roots, for instance.)
Since I don't have the proper software readily available for getting some clear TI-83 screenshots, here are the two circles graphed on Desmos:
On a TI graphing calculator, students could use a combination of ZOOM and TRACE to estimate the coordinates of Point 1. CALC -> INTERSECT would also be a good option. On Desmos, we can just click on the intersection point to get an estimate of the coordinates:
If we want greater accuracy, we can zoom in really close:
Using CALC -> INTERSECT on my TI-83 yielded an estimate of (3.4461538, -1.969231), so very similar results. If we rounded to the nearest hundredth, we can pretty solidly estimate the coordinates of Point 1 to be (3.45, -1.97). (It might be interesting to have students estimate the coordinates of Point 1 prior to using their graphing utilities to see how close they came by just "eyeballing" it.)
Of course, we said much earlier that we need three stations to determine where the submarine is. We could introduce the third station much earlier in the problem, or we could hold off until now to introduce it.
So, let's say the third station is located at (-5, 4) and detects the submarine at a range of 13 miles. Students determine the equation of the circle with this center and radius, enter it into their graphing utility, and voila:
So our enemy submarine is located at coordinates (7, -1). Huzzah!
Applying the Learning: Now, I wouldn't have gone through the whole business of figuring out how to estimate coordinates using a graphing utility if the solution was always going to be as simple as (7, -1). For something more challenging that definitely requires the assistance of a graphing utility, let's say we have the following information:
Would You Like to Play a Game?: For something really fun at the end of this problem, we would turn our scenario into a war game. I would break the students up into teams of two or three; each team gets one H.I.D.D.EN. submarine and three naval stations. Teams get to place their submarine and naval stations at whatever coordinates they choose (within certain borders, of course).
After all submarines and stations are placed, I provide each team with information about how far away each enemy submarine is located from their stations. (This adds a layer of complexity to the original problem scenario, as teams now have information about multiple submarines and they have to mix & match circles in order to pinpoint them all.) The teams then race against each other to try and be the first to locate and destroy the other submarines. Winning team gets riches and glory. Well, just glory. Not much glory.
Final Thoughts: In the end, I thought this task seemed like a fun way for students to learn about how to graph equations of circles and then apply that skill.
Hopefully, when the students share out what they learned as a result of this problem, they'll be able to articulate a deep understanding of the relationship between circles, their equations, and their graphs. It'd also be cool if some of them see the connections between equations of circles and the Pythagorean Theorem or the Distance Formula. I certainly hope they end up finding the whole thing to be a worthwhile experience.
It's definitely not perfect, but I'm looking forward to trying it out and seeing how it goes.
At the same time, this pretty much meant I had zero time to work on any PrBL stuff, especially with moving from teaching Geometry to teaching Pre-Calculus at the same time. However, our project was finally completed this past spring, so I have been happily spending the summer working on PrBL-related curriculum mapping for my Pre-Calculus and Advanced Pre-Calculus classes.
(Yes, I just said "happily" and "curriculum mapping" in the same sentence.)
Below is one PrBL task that I've been working on for a graphing unit this school year. I think (and hope) the students will have fun with it; it's not particularly all that "real-worldy," and it definitely needs refinement, but I gotta start somewhere. Of course, as with anything I haven't tried in class yet, it's a work in progress.
This task involves understanding and graphing equations of circles. I call it: BATTLESHIP!
(Although the task is not quite the same as the classic board game.)
The Scenario: You are the commander of a mighty naval fleet in the middle of international waters. The enemy has developed a new type of submarine known as a Hyperbolic Invisibility/Deep Dive ENgine, or a H.I.D.D.EN. submarine.
The enemy's H.I.D.D.EN. submarines are capable of avoiding nearly all types of radar detection. In fact, you are only able to determine the distance a H.I.D.D.EN. submarine is from any of your naval stations.
Your task is to devise a way to pinpoint the exact location of a H.I.D.D.EN. submarine. Succeed, and your forces will be able to destroy the enemy fleet. Fail, and you're doomed. DOOMED!
(If you couldn't tell, I have an affinity for silly acronyms.)
The Entry Event: Before things really kick off, I'll give the students a few warm-up problems to assess and activate their prior knowledge. Students will need to know the parts of a circle (particularly the radius and the center), and will also need to be able to re-write a two-variable equation (i.e. solve for y in terms of x). The latter will be important for graphing circles on most graphing utilities.
To introduce the problem, I'll present the following situation to students on Activeprompt:
"You are the commander of a naval station, shown here on the grid. An enemy submarine is approaching.
The submarine has a cloaking device that hides its exact location from your radar system. However, you are still able determine how far away the submarine is from the station.
The submarine is 5 miles away from the station. Where is it?"
(I could make things more interesting by removing the axes and labels, but I want to steer the students in a certain direction here.)
I posted this prompt on Twitter, and a couple of my friends immediately pointed out that they couldn't answer the question because they didn't know which direction the submarine was from the station. This is true, and in many ways is actually the point of this prompt; I suppose I should be more clear that I want students to guess where the submarine might be, and that I'm not necessarily looking for "the correct answer" at this stage.
Still, I had several responses to the prompt and ended up with something I would hope to see in class:
(Interesting, isn't it?)
Hopefully, students will take one look at this picture and notice the pattern: there appears to be a circle forming around the station. At this point, students can take some time to think about further questions: Why is there a circle? What does this circle mean? What can we figure out about this circle? What does this circle have to do with finding the submarine?
After discussion, the hope is that students would come to the following conclusions:
- The circle represents all of the possible locations of the submarine, based on the information we have.
- We have no way to determine the exact location of the submarine with our current information.
Need-to-Knows & Scaffolding: While I'm sure that my students will surprise me (students have a habit of doing that), the need-to-know that should be immediately apparent is: "How do we locate the submarine?" In fact, we begin the process of answering this question with the entry event.
Again, one of the key realizations from the entry event is that all of the possible locations of the submarine are represented by a circle, radius 5, with the naval station as its center:
A good follow-up question would be, "How do we narrow down the number of possible locations?" The answer may or may not be readily apparent. I'd encourage students to think outside the box -- or perhaps, more appropriately, "think outside the circle."
Because we could narrow down the number of possible locations if we had a second naval station. Say, at coordinates (7, -8). And it detects the submarine at a distance of 7 miles.
From here, it probably won't be a huge leap for the students to realize that adding a third naval station will narrow our choices down to just one. We'll get back to that in a moment.
A critical issue arises from this new picture: while Point 2 clearly appears to be located at the coordinates (7, -1), it's much less clear what the coordinates of Point 1 are. This should lead to another question: "How do we accurately determine the coordinates of the point(s) where the circles intersect?"
Now, this part of the task is a bit murky for me. It's not all that difficult to come up with a good estimate of Point 1's coordinates using Geometer's Sketchpad, but the point of the task is for students to work with and understand equations of circles. To this end, I want students to be working with a graphing utility (e.g. TI-83/84) as we address this question. So, yeah... if anyone has a good suggestion for how to make sure it steers in that direction, I'm all ears!
In any case, turning to our graphing calculators should bring up the question: "How do we graph circles?" The best way to do this with our graphing calculators (or an online tool like Desmos) would be to input an equation. That, of course, leads to: "What's the equation for a circle?"
At this point, appropriate scaffolding activities and workshops could be used to help students understand how to determine the equation of a circle, given the center and the radius. I'd probably also give students a few practice problems to give them some exercise in this skill. When using a graphing calculator like a TI-83 or TI-84, students would also need to know how to re-write their circle equations for y in terms of x so they can actually enter them. (This would be one advantage of using Desmos over a graphing calculator; such a conversion isn't necessary. On the other hand, re-writing equations would also be a great chance to talk about issues such as positive and negative roots, for instance.)
Since I don't have the proper software readily available for getting some clear TI-83 screenshots, here are the two circles graphed on Desmos:
On a TI graphing calculator, students could use a combination of ZOOM and TRACE to estimate the coordinates of Point 1. CALC -> INTERSECT would also be a good option. On Desmos, we can just click on the intersection point to get an estimate of the coordinates:
If we want greater accuracy, we can zoom in really close:
Using CALC -> INTERSECT on my TI-83 yielded an estimate of (3.4461538, -1.969231), so very similar results. If we rounded to the nearest hundredth, we can pretty solidly estimate the coordinates of Point 1 to be (3.45, -1.97). (It might be interesting to have students estimate the coordinates of Point 1 prior to using their graphing utilities to see how close they came by just "eyeballing" it.)
Of course, we said much earlier that we need three stations to determine where the submarine is. We could introduce the third station much earlier in the problem, or we could hold off until now to introduce it.
So, let's say the third station is located at (-5, 4) and detects the submarine at a range of 13 miles. Students determine the equation of the circle with this center and radius, enter it into their graphing utility, and voila:
So our enemy submarine is located at coordinates (7, -1). Huzzah!
Applying the Learning: Now, I wouldn't have gone through the whole business of figuring out how to estimate coordinates using a graphing utility if the solution was always going to be as simple as (7, -1). For something more challenging that definitely requires the assistance of a graphing utility, let's say we have the following information:
- Naval Station A is located at (-16.47, -3.53). It detects an enemy submarine at a distance of 12.31 miles.
- Naval Station B is located at (5.68, -3.74). It detects an enemy submarine at a distance of 13.97 miles.
- Naval Station C is located at (5.43, 5.68). It detects an enemy submarine at a distance of 11.96 miles.
Would You Like to Play a Game?: For something really fun at the end of this problem, we would turn our scenario into a war game. I would break the students up into teams of two or three; each team gets one H.I.D.D.EN. submarine and three naval stations. Teams get to place their submarine and naval stations at whatever coordinates they choose (within certain borders, of course).
After all submarines and stations are placed, I provide each team with information about how far away each enemy submarine is located from their stations. (This adds a layer of complexity to the original problem scenario, as teams now have information about multiple submarines and they have to mix & match circles in order to pinpoint them all.) The teams then race against each other to try and be the first to locate and destroy the other submarines. Winning team gets riches and glory. Well, just glory. Not much glory.
Final Thoughts: In the end, I thought this task seemed like a fun way for students to learn about how to graph equations of circles and then apply that skill.
Hopefully, when the students share out what they learned as a result of this problem, they'll be able to articulate a deep understanding of the relationship between circles, their equations, and their graphs. It'd also be cool if some of them see the connections between equations of circles and the Pythagorean Theorem or the Distance Formula. I certainly hope they end up finding the whole thing to be a worthwhile experience.
It's definitely not perfect, but I'm looking forward to trying it out and seeing how it goes.
Labels:
algebra,
battleship,
circles,
curriculum,
equations,
equations of circles,
graphing,
handsome math teacher,
math,
math education,
math task,
need-to-know,
PBL,
PrBL,
precalculus,
students,
submarines
Friday, September 14, 2012
Sometimes It's Good to Take a Detour
Probably one of the coolest things about teaching is when a student asks a really good question that lets you detour from your original plan to talk about something really super-awesome.
That happened in my class today.
We were discussing slope and going through a few example problems with the slope formula. I decided to show them one example that resulted in an undefined slope. I gave them the points (7, 3) and (7, 10), then we worked through the problem. We got to a point where we had 7/0 on the board and I asked the students what that meant. The consensus was that the slope was undefined because "we can't divide by zero."
Then, one of my students asked: "Mr. Brenneman, why can't we divide by zero?"
I stopped. I looked at him. I said, "I love that question! Let's put aside what we're doing and talk about this!"
I then launched into a brief explanation of proof by contradiction and asked them to put aside the laws of mathematics for one second. "Let's suppose that you can divide by zero," I said. "Let's consider what 0/0 would be equal to. What do you think?"
Many students chimed in with "0." Others chimed in with "1." I asked each side to back up their reasoning.
"Well, it would be zero because you're dividing zero by another number," one student said.
"I think it would be one, because 2/2 is 1, 4/4 is 1, so 0/0 would be 1," said another.
A few minds were blown when I told them they were both right.
Here's why:
Assuming we can divide by zero, the quotient of 0/0 yields two distinct yet equally valid results.
Suppose we choose a number a from all of the numbers in existence. We say that 0/a = 0 (the zero property of division) and a/a = 1 (a form of the multiplicative inverse property).
In this scenario, division by zero is allowable. (This is an important distinction, because normally the two properties I mentioned above specify that a must be nonzero.) So, 0/0 = 0 by the zero property. But, 0/0 = 1 by the multiplicative inverse property.
Thus, it is reasonable to conclude that 0/0 = 0 and 0/0 = 1.
In other words, 0 = 1.
The discussion can certainly stop here, because we have arrived at a conclusion that is mathematically absurd. Furthermore, this absurdity stems from the initial assumption that we can divide by zero; hence, we must conclude that we cannot divide by zero.
But I knew that ending our discussion at 0 = 1 wouldn't have been nearly quite as fun as proceeding with even more absurdity.
So, I asked the students, "what would 1 + 1 be equal to?"
Many said 2. Some said 1. They were all correct. I showed them why.
1 + 1 certainly equals 2. But, we've already established that 1 = 0, so we can also say that 1 + 1 = 1 + 0 = 1. Or, 1 + 1 = 0 + 0 = 0.
In other words, 0 = 1 = 2.
I extended it one more time by asking the students what 1 + 1 + 1 would equal. Some said 3, some said 2, some said 1. Again, they were all correct. Using similar reasoning as the "1 + 1" case, we concluded that 0 = 1 = 2 = 3.
At that point, the students came to realize that if we kept going, eventually we would conclude that all numbers would be equal to each other.
I told the students one of my favorite mathematically absurd things to say: "If Congress legalized division by zero, we could solve all of our economic problems. We wouldn't have a $15 trillion debt, because if we can divide by zero then 15 trillion would be equal to zero. We wouldn't owe anyone $15 trillion. Problem solved!"
My students seemed to love it. Sometimes it's fun to drop what we're doing and discuss something far more interesting when the opportunity arises.
That happened in my class today.
We were discussing slope and going through a few example problems with the slope formula. I decided to show them one example that resulted in an undefined slope. I gave them the points (7, 3) and (7, 10), then we worked through the problem. We got to a point where we had 7/0 on the board and I asked the students what that meant. The consensus was that the slope was undefined because "we can't divide by zero."
Then, one of my students asked: "Mr. Brenneman, why can't we divide by zero?"
I stopped. I looked at him. I said, "I love that question! Let's put aside what we're doing and talk about this!"
I then launched into a brief explanation of proof by contradiction and asked them to put aside the laws of mathematics for one second. "Let's suppose that you can divide by zero," I said. "Let's consider what 0/0 would be equal to. What do you think?"
Many students chimed in with "0." Others chimed in with "1." I asked each side to back up their reasoning.
"Well, it would be zero because you're dividing zero by another number," one student said.
"I think it would be one, because 2/2 is 1, 4/4 is 1, so 0/0 would be 1," said another.
A few minds were blown when I told them they were both right.
Here's why:
Assuming we can divide by zero, the quotient of 0/0 yields two distinct yet equally valid results.
Suppose we choose a number a from all of the numbers in existence. We say that 0/a = 0 (the zero property of division) and a/a = 1 (a form of the multiplicative inverse property).
In this scenario, division by zero is allowable. (This is an important distinction, because normally the two properties I mentioned above specify that a must be nonzero.) So, 0/0 = 0 by the zero property. But, 0/0 = 1 by the multiplicative inverse property.
Thus, it is reasonable to conclude that 0/0 = 0 and 0/0 = 1.
In other words, 0 = 1.
The discussion can certainly stop here, because we have arrived at a conclusion that is mathematically absurd. Furthermore, this absurdity stems from the initial assumption that we can divide by zero; hence, we must conclude that we cannot divide by zero.
But I knew that ending our discussion at 0 = 1 wouldn't have been nearly quite as fun as proceeding with even more absurdity.
So, I asked the students, "what would 1 + 1 be equal to?"
Many said 2. Some said 1. They were all correct. I showed them why.
1 + 1 certainly equals 2. But, we've already established that 1 = 0, so we can also say that 1 + 1 = 1 + 0 = 1. Or, 1 + 1 = 0 + 0 = 0.
In other words, 0 = 1 = 2.
I extended it one more time by asking the students what 1 + 1 + 1 would equal. Some said 3, some said 2, some said 1. Again, they were all correct. Using similar reasoning as the "1 + 1" case, we concluded that 0 = 1 = 2 = 3.
At that point, the students came to realize that if we kept going, eventually we would conclude that all numbers would be equal to each other.
I told the students one of my favorite mathematically absurd things to say: "If Congress legalized division by zero, we could solve all of our economic problems. We wouldn't have a $15 trillion debt, because if we can divide by zero then 15 trillion would be equal to zero. We wouldn't owe anyone $15 trillion. Problem solved!"
My students seemed to love it. Sometimes it's fun to drop what we're doing and discuss something far more interesting when the opportunity arises.
Wednesday, September 12, 2012
A Not-At-All Comprehensive Review of Socrative
At the start of the school year, our Assistant Principal introduced me to a student clicker-type program called Socrative. It's free and can be used in your web browser or downloaded as an app to a mobile device (available for iOS and Android devices).
I've been testing this out in my class for the past couple of weeks and have been rather impressed by the results.
There are essentially two modes for using Socrative: you can administer a pre-written quiz to your students with multiple-choice questions and free response questions, or you can administer a quick one-question activity on the fly.
I've been using the pre-built quiz feature for the past few days as a warm-up activity for my students when they get to my classroom. Students log on to their desktop computers (or sign on to Socrative on their smartphones) and complete a question related to the current skill they are working on.
I was asked to demonstrate Socrative to my colleagues at today's staff meeting, so I wrote a sample quiz for them. Here was one of the multiple-choice questions:
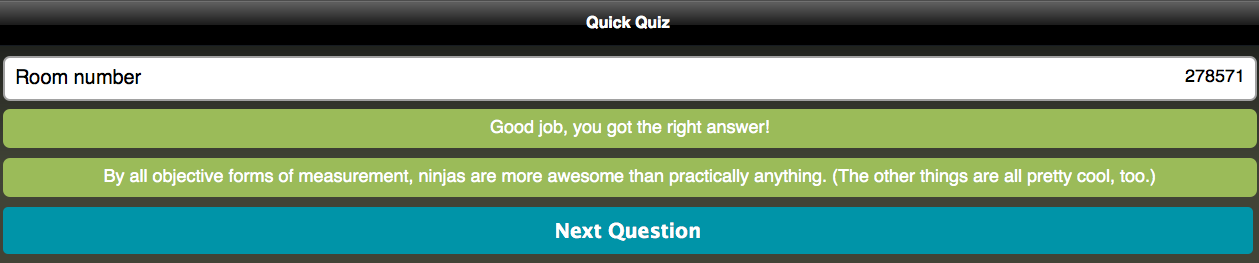
You can set the quiz to give instant feedback when an answer is selected. In this case, the answer was obviously "ninjas."
Now, while students are taking the quiz, the teacher can use their end of the software to monitor progress and results in real time:
Free-response questions can also be built into a Socrative quiz. Here's an example from the quiz from the staff meeting:
Now, obviously I use this in a far more practical manner in the classroom. (That's not to say that questions about ninjas and ice cream aren't important, BECAUSE THEY ARE.) For instance, here is the warm-up question I administered to my students this morning:
Now, here's the really cool part.
When I see that the students have finished, I end the activity. Then, I am presented with the option to e-mail a report to myself.
So this morning when my students finished their warm-up question, I had a report e-mailed to me. A few minutes later, this arrived in my inbox (student names have been removed):
Formative performance data that can inform and drive my classroom instruction to best meet the needs of my students? All organized and color-coded in an Excel spreadsheet? And this software is free? HOLY CRAP. YES PLEASE.
But wait! There's more!
If you don't have time to write a quiz in Socrative, that's no problem at all. Socrative also allows for a quick one-question option that allows you to assess students on the fly.
On the teacher control panel, you can choose to start a quick multiple choice, true/false, or short answer activity:
You can announce the question orally, or provide it in a written format on paper, dry erase board, online LMS, napkin, ankle tattoo, whatever. Say you wanted to do a true/false question. You select this option, and the students see this on their screen:
Notice that there's no question displayed. As I mentioned, it's up to you to present the question however you want. The point is that you can use Socrative on the fly to formatively assess your students as well. You can also monitor results in real time, though there won't be names attached (so this is also good for taking an anonymous poll). The downside, however, is that you can't e-mail a report to yourself in this mode.
So far, I'm seeing great advantages to using Socrative in my classroom. It's a very handy way for me to quickly collect and organize formative assessment data before, during, and after a lesson. It allows me to more effectively monitor my students' learning and to make appropriate instructional decisions. And, since Socrative can be downloaded as an app to mobile devices, it's also conducive to a BYOT classroom environment.
Probably the one thing I really wish Socrative could do is recognize math type. In the slope question above, I had to settle for typing "1/3" and "5/6" instead of putting them into a less-confusing vertical format. There's also no way to insert charts, graphs, tables, etc. There are ways to get around this, of course. (I can post the full question in another medium that supports math-type and have the students submit their responses via Socrative.) Still, it would be convenient to have these features present. (EDIT 8/22/2013: In the past year since this post was written, Socrative has added the ability to post images. This provides another way around the issue. Sweet!)
Overall, this is a great piece of software and is a very simple way of recording formative assessment data. Works great in a 1:1 technology environment, provides real-time results, and supports data-driven instructional practice. I give it four out of five ninjas.
RATING:
(Trust me, there are four ninjas next to "RATING:" here. You can't see them, because they're ninjas.)
I've been testing this out in my class for the past couple of weeks and have been rather impressed by the results.
There are essentially two modes for using Socrative: you can administer a pre-written quiz to your students with multiple-choice questions and free response questions, or you can administer a quick one-question activity on the fly.
I've been using the pre-built quiz feature for the past few days as a warm-up activity for my students when they get to my classroom. Students log on to their desktop computers (or sign on to Socrative on their smartphones) and complete a question related to the current skill they are working on.
I was asked to demonstrate Socrative to my colleagues at today's staff meeting, so I wrote a sample quiz for them. Here was one of the multiple-choice questions:
You can set the quiz to give instant feedback when an answer is selected. In this case, the answer was obviously "ninjas."
Now, while students are taking the quiz, the teacher can use their end of the software to monitor progress and results in real time:
Free-response questions can also be built into a Socrative quiz. Here's an example from the quiz from the staff meeting:
Now, obviously I use this in a far more practical manner in the classroom. (That's not to say that questions about ninjas and ice cream aren't important, BECAUSE THEY ARE.) For instance, here is the warm-up question I administered to my students this morning:
Now, here's the really cool part.
When I see that the students have finished, I end the activity. Then, I am presented with the option to e-mail a report to myself.
So this morning when my students finished their warm-up question, I had a report e-mailed to me. A few minutes later, this arrived in my inbox (student names have been removed):
Formative performance data that can inform and drive my classroom instruction to best meet the needs of my students? All organized and color-coded in an Excel spreadsheet? And this software is free? HOLY CRAP. YES PLEASE.
But wait! There's more!
If you don't have time to write a quiz in Socrative, that's no problem at all. Socrative also allows for a quick one-question option that allows you to assess students on the fly.
On the teacher control panel, you can choose to start a quick multiple choice, true/false, or short answer activity:
You can announce the question orally, or provide it in a written format on paper, dry erase board, online LMS, napkin, ankle tattoo, whatever. Say you wanted to do a true/false question. You select this option, and the students see this on their screen:
Notice that there's no question displayed. As I mentioned, it's up to you to present the question however you want. The point is that you can use Socrative on the fly to formatively assess your students as well. You can also monitor results in real time, though there won't be names attached (so this is also good for taking an anonymous poll). The downside, however, is that you can't e-mail a report to yourself in this mode.
So far, I'm seeing great advantages to using Socrative in my classroom. It's a very handy way for me to quickly collect and organize formative assessment data before, during, and after a lesson. It allows me to more effectively monitor my students' learning and to make appropriate instructional decisions. And, since Socrative can be downloaded as an app to mobile devices, it's also conducive to a BYOT classroom environment.
Probably the one thing I really wish Socrative could do is recognize math type. In the slope question above, I had to settle for typing "1/3" and "5/6" instead of putting them into a less-confusing vertical format. There's also no way to insert charts, graphs, tables, etc. There are ways to get around this, of course. (I can post the full question in another medium that supports math-type and have the students submit their responses via Socrative.) Still, it would be convenient to have these features present. (EDIT 8/22/2013: In the past year since this post was written, Socrative has added the ability to post images. This provides another way around the issue. Sweet!)
Overall, this is a great piece of software and is a very simple way of recording formative assessment data. Works great in a 1:1 technology environment, provides real-time results, and supports data-driven instructional practice. I give it four out of five ninjas.
RATING:
(Trust me, there are four ninjas next to "RATING:" here. You can't see them, because they're ninjas.)
Wednesday, August 15, 2012
Project Idea: Math, Social Studies, and 'MURRICA!
I've had a half-baked idea for a project tossing around in my head for the past few weeks that I've been meaning to share. It's nowhere near perfect or ready to go, but I think it has some really cool potential. So, here we go:
It's an idea for a math and social studies project centered around the 2012 election.
(Math and social studies! I know, right?)
The idea is simple: Students work to answer the driving question, "What are the keys to winning the 2012 presidential election?"
Anyone who has been paying attention to the news (or who haven't been living under a rock at any point since 2008) probably have an idea of what the hot-button issues are, or which swing states will be most crucial to securing the presidency. For the math end of this project, however, numbers will tell the story.
As part of the process to answer the driving question, students will examine various sources of polling data. Gallup, for instance, has a daily tracking poll and plenty of polling data broken down by demographics. RealClearPolitics gathers and averages polling data from battleground states. Various electoral maps, such as this one on CNN's website, are available as well. Rasmussen Reports has polling data showing what issues are most important to Americans today. In short, lots of data to examine and interpret.
Students will gather and examine polling data to determine a few key points, including which states the candidates should focus most of their resources on and which issues the candidates should focus on. Their data analysis will be used to justify why they identified particular states and issues as being the most important to focus on.
For the final product in the math portion of this project, students will create a multimedia presentation to deliver their findings and make recommendations to both the campaigns of President Obama and Governor Romney as to how they should focus their campaigns in the final weeks leading up to the election. These presentations are to be posted to our class blog (which I have yet to set up -- I'd better get going on that) and will also be forwarded to both campaigns. (Hopefully, they'll even take time to look at them!)
I've been talking with the social studies teacher on my grade-level team about this project. It sounds like he and his English co-facilitator are planning to run a debate project at the start of the year that this could actually fit into. I think having the students use data to identify what issues are most important to Americans would then lead them to investigate why those issues are important, which would lend itself well to research for a debate. The math can inform their approach to debating various issues.
So that's my half-baked project idea to this point. There's certainly much more that needs to be thought about as I develop this into something workable.
For instance, I talked about students "using data analysis," but haven't gotten very far on how students will actually learn what it is and how to apply the skill. I think I could especially use some help there.
Also, I'm wondering if there's a place for linear modeling in here with the polling data (particularly since the first unit of the year is supposed to be linear equations/inequalities).
Other ideas I've had to far include: utilizing social media to talk directly to people in battleground states and survey them on what issues are important to them; convincing someone from Gallup or another polling agency to Skype with the class and talk about how they conduct their polls; convincing someone from either the Obama or Romney campaigns to Skype with the class about how they use polling data or other statistics to drive decisions about how they conduct their campaigns.
(Also, it would be really cool to come up with a way to make this work with #MYParty12.)
Anyway, that's it. As I said, I think there's lots of potential here, but I can definitely use as much help as I can get. If even one or two of you out there have thoughts or "I wonders" on this, please share! Otherwise, thanks for reading!
It's an idea for a math and social studies project centered around the 2012 election.
(Math and social studies! I know, right?)
The idea is simple: Students work to answer the driving question, "What are the keys to winning the 2012 presidential election?"
Anyone who has been paying attention to the news (or who haven't been living under a rock at any point since 2008) probably have an idea of what the hot-button issues are, or which swing states will be most crucial to securing the presidency. For the math end of this project, however, numbers will tell the story.
As part of the process to answer the driving question, students will examine various sources of polling data. Gallup, for instance, has a daily tracking poll and plenty of polling data broken down by demographics. RealClearPolitics gathers and averages polling data from battleground states. Various electoral maps, such as this one on CNN's website, are available as well. Rasmussen Reports has polling data showing what issues are most important to Americans today. In short, lots of data to examine and interpret.
Students will gather and examine polling data to determine a few key points, including which states the candidates should focus most of their resources on and which issues the candidates should focus on. Their data analysis will be used to justify why they identified particular states and issues as being the most important to focus on.
For the final product in the math portion of this project, students will create a multimedia presentation to deliver their findings and make recommendations to both the campaigns of President Obama and Governor Romney as to how they should focus their campaigns in the final weeks leading up to the election. These presentations are to be posted to our class blog (which I have yet to set up -- I'd better get going on that) and will also be forwarded to both campaigns. (Hopefully, they'll even take time to look at them!)
I've been talking with the social studies teacher on my grade-level team about this project. It sounds like he and his English co-facilitator are planning to run a debate project at the start of the year that this could actually fit into. I think having the students use data to identify what issues are most important to Americans would then lead them to investigate why those issues are important, which would lend itself well to research for a debate. The math can inform their approach to debating various issues.
So that's my half-baked project idea to this point. There's certainly much more that needs to be thought about as I develop this into something workable.
For instance, I talked about students "using data analysis," but haven't gotten very far on how students will actually learn what it is and how to apply the skill. I think I could especially use some help there.
Also, I'm wondering if there's a place for linear modeling in here with the polling data (particularly since the first unit of the year is supposed to be linear equations/inequalities).
Other ideas I've had to far include: utilizing social media to talk directly to people in battleground states and survey them on what issues are important to them; convincing someone from Gallup or another polling agency to Skype with the class and talk about how they conduct their polls; convincing someone from either the Obama or Romney campaigns to Skype with the class about how they use polling data or other statistics to drive decisions about how they conduct their campaigns.
(Also, it would be really cool to come up with a way to make this work with #MYParty12.)
Anyway, that's it. As I said, I think there's lots of potential here, but I can definitely use as much help as I can get. If even one or two of you out there have thoughts or "I wonders" on this, please share! Otherwise, thanks for reading!
Labels:
#MYParty12,
algebra,
data,
data analysis,
election,
English,
handsome math teacher,
math,
need-to-know,
Obama,
PBL,
polling,
polls,
PrBL,
question,
Romney,
social studies,
statistics,
want-to-know
Sunday, August 5, 2012
Algebra Isn't the Issue: A Response to "Is Algebra Necessary?"
I have a knack for being fashionably late with chiming in on controversial happenings. Responding to Dr. Andrew Hacker's op-ed piece, "Is Algebra Necessary?" is certainly no exception here.
There have been numerous responses around the blogosphere on this topic already from my fellow math teachers. Dan Willingham posted a particularly well-constructed rebuttal the day after the column was published. The uproar from the math education community comes as no surprise, nor does Dr. Hacker's cheeky response to the outpouring of criticism.
I could certainly dive into the fracas and expound upon the merits of teaching algebra while lamenting the current state of math education under the shadow of No Child Left Behind, but I think a more important issue may be getting lost in the conversation.
In this clip from Monday's episode of CNN's Starting Point with Soledad O'Brien, Dr. Steve Perry of Capital Preparatory Magnet School (Hartford, CT), in discussing Hacker's column, tells O'Brien that algebra "does present a real barrier" for students that come from historically disadvantaged backgrounds.
Perry goes on to refer to algebra as a "gatekeeper," citing a "one-size-fits-all" approach to the academic experience that is detrimental to cultivating success for all students. He asserts that children need experiences that they can be "more connected to" while emphasizing rigor, relationships, and relevance.
Judging by their reactions, O'Brien and co-panelist Margaret Hoover seemed to think Perry was taking Hacker's position that teaching algebra wasn't necessary. Indeed, when one watches this video for the first time, it certainly sounds like Perry agrees with Hacker in many respects.
Hoover seemed particularly incensed, jumping on Perry and pointing out that learning algebra has benefits for developing critical thinking skills that are vital to students later on in life.
That wasn't Perry's point, though. He notes that "it's 2012" and asks the question, "why are we teaching the same things the way we've always taught them?"
The point is this: The problem is not the fact that students are failing algebra. The problem is that we're not doing enough to address why they're failing algebra.
Perry touches on what I think the major underlying issue is with the growing number of students that are struggling with algebra: It's not that algebra is too hard or unnecessary. It's that students from economically disadvantaged backgrounds are not getting the support they need throughout their childhood to be equipped for academic success.
This excerpt from Hacker's editorial reveals a surprising lapse of understanding of the issue on his part:
This is a rather odd thing to read, coming from the same man who wrote a New York Times #1 bestseller on racial inequality in America. For instance, he only mentions how white students performed on these state standardized tests; though he mentions black students in this passage, he doesn't even bother to mention how they performed, perpetuating an image that black students are incapable of performing as well as white students. This is an egregious and irresponsible omission.
Equally troubling is the fact that Hacker seems to link being white with being affluent in the same fashion. He makes no distinction between how well low-income students performed on these tests compared to students who are not from low-income households. Yet this seems like an important distinction to make, particularly in the case of Tennessee which has a high population of economically disadvantaged students.
To be fair, comparison data between economic subgroups is not always readily available. The 2011 Tennessee Department of Education Report Card, for instance -- where Hacker got his "39 percent" figure -- provides a disaggregation of test performance data describing participation and results from various subgroups. However, this does not include students from non-low-income households.
That's not too much of a problem, though. We can determine how non-low-income students performed by utilizing basic set theory and a bit of -- gasp! -- algebra. We can then use this information to get a pretty good idea of how many of the "39 percent" of white students that scored below proficiency were also economically disadvantaged.
Taking the time to do some number-crunching, one can determine the following from the data provided by the Tennessee DOE (all figures are from 2011):
With these numbers, we can find some overlap between the white subgroup and the economically disadvantaged subgroup:
This is an extremely conservative estimate, as it assumes every non-white student that didn't meet proficiency also came from an economically disadvantaged background (an unrealistic assumption, if not completely absurd). In other words, the actual number of economically disadvantaged white students in Tennessee that didn't meet proficiency in math is most likely much higher. There is a considerable performance gap between economically disadvantaged students and their peers.
So, intentional or not, Hacker downplays the plight of economically disadvantaged students with his unqualified claim that algebra presents a burdensome obstacle for students regardless of their ethnic or economic background.
This is an incredibly unfortunate oversight, because the truth is that poverty is a major factor in determining a child's preparedness to succeed in school. If Hacker wants to talk about an "onerous stumbling block for all students," he shouldn't be discussing algebra. He should be discussing poverty, which is independent of race (Burney & Beilke, 2008) and perhaps the root cause of many students' failures to complete high school. It is a major issue that warrants our attention and discussion.
Students who come from economically disadvantaged households have parents who not only have low incomes, but often a lower level of education than parents from other households. Both of these are indicators of how likely a student is to be successful in school (Davis-Kean, 2005). Such students are less likely to value education and to have the necessary resources at home to prepare them to succeed in their academic pursuits.
Many economically disadvantaged students live in concentrated urban settings that do not always attract high-quality teachers, further diminishing their chances of academic success (Burney & Beilke, 2008).
On top of this, poverty is often viewed as being an "individual problem," associated with laziness, apathy, amorality, lawlessness, poor parenting and a lack of education (Bullock, 2006). This stigma is an incredible barrier for economically disadvantaged students, particularly when their teachers accept this stigma as reality.
There is truth in what Dr. Perry said about algebra being a barrier for students from historically disadvantaged groups. None of the factors described above bode well for a student's ability to succeed in their K-12 education, let alone in algebra.
Blaming algebra for the failure of these students to graduate from high school or finish an undergraduate degree is like blaming the 20th mile for a one-legged runner's failure to finish a marathon. We shouldn't be addressing whether or not the 20th mile is too hard, we should be addressing the fact that the runner is missing a leg.
So before we question whether or not algebra is necessary, we should be questioning whether or not we, as a society, are doing everything we can to equip all of our students to be successful in their K-12 education. All students need equitable access to the support and resources necessary to successfully complete their education. Facing this challenge must be a priority if we really want our students to realize their potential.
In the meantime, we must also heed Dr. Perry's call to emphasize rigor, relationships, and relevance in our classrooms. We are going to continue getting students that are ill-prepared for educational success, and we are going to need to be creative to support their needs. This requires getting to know our students: what their interests are and how they learn. Doing so equips us to provide such students with opportunities for meaningful, authentic learning experiences that can capture their attention, connect new knowledge to old, and help them see the value in what they're learning.
For the record, I do think teaching algebra is necessary; but that's not the issue here.
Bullock, H. (2006). Justifying inequality: A social psychological analysis of beliefs about poverty and the poor (National Poverty Center Working Paper Series #06-08). Ann Arbor, MI: University of Michigan. Retrieved August 4, 2012, from www.npc.umich.edu/publications/workingpaper06/paper08/working_paper06-08.pdf
Burney, V.H. & Beilke, J.R. (2008). The constraints of poverty on high achievement. Journal for the Education of the Gifted, 31(3), 295-321.
Davis-Kean, P.E. (2005). The influence of parent education and family income on child achievement: The indirect role of parental expectations and the home environment. Journal of Family Psychology, 19(2), 294-304.
There have been numerous responses around the blogosphere on this topic already from my fellow math teachers. Dan Willingham posted a particularly well-constructed rebuttal the day after the column was published. The uproar from the math education community comes as no surprise, nor does Dr. Hacker's cheeky response to the outpouring of criticism.
I could certainly dive into the fracas and expound upon the merits of teaching algebra while lamenting the current state of math education under the shadow of No Child Left Behind, but I think a more important issue may be getting lost in the conversation.
In this clip from Monday's episode of CNN's Starting Point with Soledad O'Brien, Dr. Steve Perry of Capital Preparatory Magnet School (Hartford, CT), in discussing Hacker's column, tells O'Brien that algebra "does present a real barrier" for students that come from historically disadvantaged backgrounds.
Perry goes on to refer to algebra as a "gatekeeper," citing a "one-size-fits-all" approach to the academic experience that is detrimental to cultivating success for all students. He asserts that children need experiences that they can be "more connected to" while emphasizing rigor, relationships, and relevance.
Judging by their reactions, O'Brien and co-panelist Margaret Hoover seemed to think Perry was taking Hacker's position that teaching algebra wasn't necessary. Indeed, when one watches this video for the first time, it certainly sounds like Perry agrees with Hacker in many respects.
Hoover seemed particularly incensed, jumping on Perry and pointing out that learning algebra has benefits for developing critical thinking skills that are vital to students later on in life.
That wasn't Perry's point, though. He notes that "it's 2012" and asks the question, "why are we teaching the same things the way we've always taught them?"
The point is this: The problem is not the fact that students are failing algebra. The problem is that we're not doing enough to address why they're failing algebra.
Perry touches on what I think the major underlying issue is with the growing number of students that are struggling with algebra: It's not that algebra is too hard or unnecessary. It's that students from economically disadvantaged backgrounds are not getting the support they need throughout their childhood to be equipped for academic success.
This excerpt from Hacker's editorial reveals a surprising lapse of understanding of the issue on his part:
Algebra is an onerous stumbling block for all kinds of students: disadvantaged and affluent, black and white. In New Mexico, 43 percent of white students fell below “proficient,” along with 39 percent in Tennessee.
This is a rather odd thing to read, coming from the same man who wrote a New York Times #1 bestseller on racial inequality in America. For instance, he only mentions how white students performed on these state standardized tests; though he mentions black students in this passage, he doesn't even bother to mention how they performed, perpetuating an image that black students are incapable of performing as well as white students. This is an egregious and irresponsible omission.
Equally troubling is the fact that Hacker seems to link being white with being affluent in the same fashion. He makes no distinction between how well low-income students performed on these tests compared to students who are not from low-income households. Yet this seems like an important distinction to make, particularly in the case of Tennessee which has a high population of economically disadvantaged students.
To be fair, comparison data between economic subgroups is not always readily available. The 2011 Tennessee Department of Education Report Card, for instance -- where Hacker got his "39 percent" figure -- provides a disaggregation of test performance data describing participation and results from various subgroups. However, this does not include students from non-low-income households.
That's not too much of a problem, though. We can determine how non-low-income students performed by utilizing basic set theory and a bit of -- gasp! -- algebra. We can then use this information to get a pretty good idea of how many of the "39 percent" of white students that scored below proficiency were also economically disadvantaged.
Taking the time to do some number-crunching, one can determine the following from the data provided by the Tennessee DOE (all figures are from 2011):
- About 443,720 students in total scored below proficiency in math.
- About 318,381 of these students were economically disadvantaged.
- About 262,352 of these students were white; 181,368 students were not.
With these numbers, we can find some overlap between the white subgroup and the economically disadvantaged subgroup:
- Suppose all 181,368 non-white students who scored below proficiency were also economically disadvantaged. If we remove them from the 318,381 economically disadvantaged students that scored below proficiency, there would be 137,013 students left over.
- This means that, at minimum, 137,013 economically disadvantaged students that scored below proficiency were also white.
- In other words, more than half (at least 52.2%) of the 262,352 white students in Tennessee that failed to meet proficiency in math were economically disadvantaged.
This is an extremely conservative estimate, as it assumes every non-white student that didn't meet proficiency also came from an economically disadvantaged background (an unrealistic assumption, if not completely absurd). In other words, the actual number of economically disadvantaged white students in Tennessee that didn't meet proficiency in math is most likely much higher. There is a considerable performance gap between economically disadvantaged students and their peers.
So, intentional or not, Hacker downplays the plight of economically disadvantaged students with his unqualified claim that algebra presents a burdensome obstacle for students regardless of their ethnic or economic background.
This is an incredibly unfortunate oversight, because the truth is that poverty is a major factor in determining a child's preparedness to succeed in school. If Hacker wants to talk about an "onerous stumbling block for all students," he shouldn't be discussing algebra. He should be discussing poverty, which is independent of race (Burney & Beilke, 2008) and perhaps the root cause of many students' failures to complete high school. It is a major issue that warrants our attention and discussion.
Students who come from economically disadvantaged households have parents who not only have low incomes, but often a lower level of education than parents from other households. Both of these are indicators of how likely a student is to be successful in school (Davis-Kean, 2005). Such students are less likely to value education and to have the necessary resources at home to prepare them to succeed in their academic pursuits.
Many economically disadvantaged students live in concentrated urban settings that do not always attract high-quality teachers, further diminishing their chances of academic success (Burney & Beilke, 2008).
On top of this, poverty is often viewed as being an "individual problem," associated with laziness, apathy, amorality, lawlessness, poor parenting and a lack of education (Bullock, 2006). This stigma is an incredible barrier for economically disadvantaged students, particularly when their teachers accept this stigma as reality.
There is truth in what Dr. Perry said about algebra being a barrier for students from historically disadvantaged groups. None of the factors described above bode well for a student's ability to succeed in their K-12 education, let alone in algebra.
Blaming algebra for the failure of these students to graduate from high school or finish an undergraduate degree is like blaming the 20th mile for a one-legged runner's failure to finish a marathon. We shouldn't be addressing whether or not the 20th mile is too hard, we should be addressing the fact that the runner is missing a leg.
So before we question whether or not algebra is necessary, we should be questioning whether or not we, as a society, are doing everything we can to equip all of our students to be successful in their K-12 education. All students need equitable access to the support and resources necessary to successfully complete their education. Facing this challenge must be a priority if we really want our students to realize their potential.
In the meantime, we must also heed Dr. Perry's call to emphasize rigor, relationships, and relevance in our classrooms. We are going to continue getting students that are ill-prepared for educational success, and we are going to need to be creative to support their needs. This requires getting to know our students: what their interests are and how they learn. Doing so equips us to provide such students with opportunities for meaningful, authentic learning experiences that can capture their attention, connect new knowledge to old, and help them see the value in what they're learning.
For the record, I do think teaching algebra is necessary; but that's not the issue here.
Bullock, H. (2006). Justifying inequality: A social psychological analysis of beliefs about poverty and the poor (National Poverty Center Working Paper Series #06-08). Ann Arbor, MI: University of Michigan. Retrieved August 4, 2012, from www.npc.umich.edu/publications/workingpaper06/paper08/working_paper06-08.pdf
Burney, V.H. & Beilke, J.R. (2008). The constraints of poverty on high achievement. Journal for the Education of the Gifted, 31(3), 295-321.
Davis-Kean, P.E. (2005). The influence of parent education and family income on child achievement: The indirect role of parental expectations and the home environment. Journal of Family Psychology, 19(2), 294-304.
Labels:
algebra,
andrew hacker,
controversy,
economic disadvantage,
handsome math teacher,
is algebra necessary,
low income,
marathon,
math,
math education,
new york times,
question,
steve perry
Subscribe to:
Posts (Atom)